
By: Bart Baesens, Seppe vanden Broucke
This QA first appeared in Data Science Briefings, the DataMiningApps newsletter as a “Free Tweet Consulting Experience” — where we answer a data science or analytics question of 140 characters maximum. Also want to submit your question? Just Tweet us @DataMiningApps. Want to remain anonymous? Then send us a direct message and we’ll keep all your details private. Subscribe now for free if you want to be the first to receive our articles and stay up to data on data science news, or follow us @DataMiningApps.
You asked: I am currently working on a segmentation exercise using k-means clustering in direct marketing based on the RFM (Recency, Frequency, Monetary) variables. Can you give me some advice on clustering interpretation and evaluation?
Our answer:
Evaluating a clustering solution is by no means a trivial exercise since there exists no universal criterion. From a statistical perspective, the sum of squared errors (SSE) can be computed as follows (enable image viewing in your e-mail to see the images below):
whereby K represents the number of clusters and mi the centroid (e.g. mean) of cluster i. When comparing two clustering solutions, the one with the lowest SSE can then be chosen.
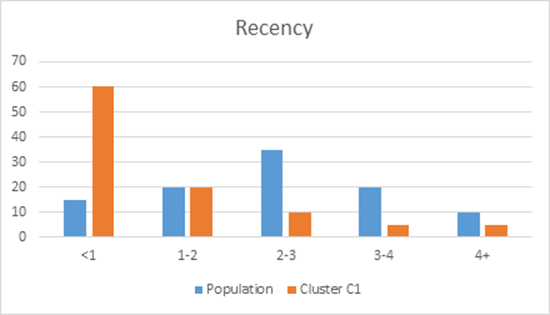
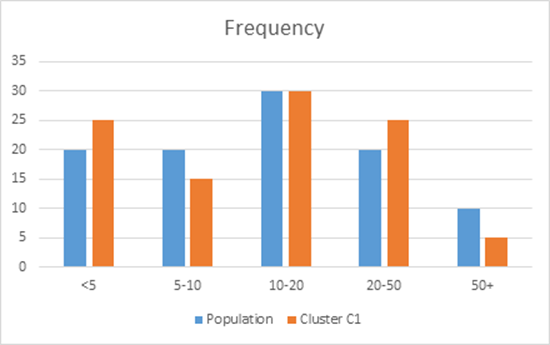
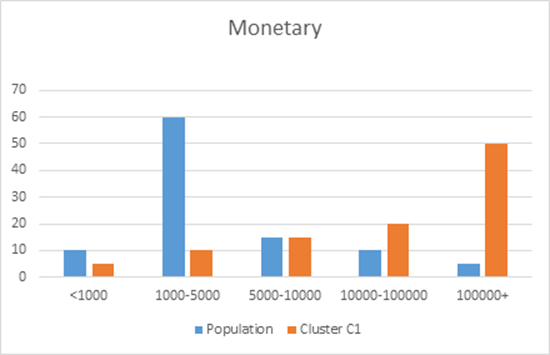
Besides a statistical evaluation, a clustering solution will also be evaluated in terms of its interpretation. To facilitate the interpretation of a clustering solution, various options are available. A first one is to compare cluster distributions with population distributions across all variables on a cluster by cluster basis. This is illustrated in the below figure whereby the distribution of a cluster C1 is contrasted with the overall population distribution for the Recency, Frequency and Monetary variables. It can be clearly seen that Cluster C1 has observations with low recency values and high monetary values, whereas the frequency is relatively similar to the original population.
Another way to explain a given clustering solution is by building a decision tree with the ClusterID as the target variable. Assume we have the following output from a k-means clustering exercise with k equal to 4.
| Claim | Recency | Frequency | Monetary | … | Cluster |
| Claim #1 | … | … | … | … | 2 |
| Claim #2 | … | … | … | … | 4 |
| Claim #3 | … | … | … | … | 3 |
| Claim #4 | … | … | … | … | 2 |
| Claim #5 | … | … | … | … | 1 |
| Claim #6 | … | … | … | … | 4 |
| … | … | … | … | … | … |
We can now build a decision tree with the ClusterID as the target variable as follows:
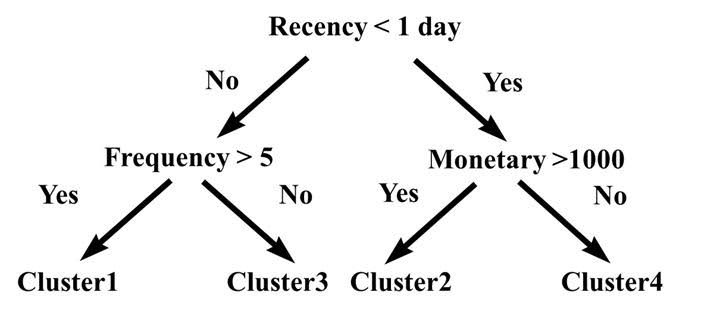
The decision tree in the above figures gives us a clear insight into the distinguishing characteristics of the various clusters. E.g., Cluster 2 is characterized by observations having recency < 1 day and monetary > 1000. Hence, using decision trees, we can easily match new observations to the existing clusters. This is an example of how supervised or predictive techniques can be used to explain the solution from a descriptive analytics exercise.