
By: Bart Baesens, Seppe vanden Broucke
This QA first appeared in Data Science Briefings, the DataMiningApps newsletter as a “Free Tweet Consulting Experience” — where we answer a data science or analytics question of 140 characters maximum. Also want to submit your question? Just Tweet us @DataMiningApps. Want to remain anonymous? Then send us a direct message and we’ll keep all your details private. Subscribe now for free if you want to be the first to receive our articles and stay up to data on data science news, or follow us @DataMiningApps.
You asked: What is a system stability index (SSI) and how can it be used to monitor population stability?
Our answer:
A system stability index (SSI) is calculated by contrasting the expected or training, and observed or actual population percentages across the various score ranges of a scorecard. In other words it is calculated as:
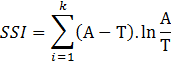
Example:
| Score Range |
Expected (training) % |
Observed (actual) % | SSI |
| 0-169 | 6% | 7% | 0.0015 |
| 170-179 | 10% | 8% | 0.0045 |
| 180-189 | 9% | 7% | 0.0050 |
| 190-199 | 12% | 9% | 0.0086 |
| 200-209 | 12% | 11% | 0.0009 |
| 210-219 | 8% | 11% | 0.0096 |
| 220-229 | 7% | 10% | 0.0107 |
| 230-239 | 8% | 12% | 0.0162 |
| 240-249 | 12% | 11% | 0.0009 |
| 250+ | 16% | 14% | 0.0027 |
| 100% | 100% | 0.0605 |
Important to note is that the percentages reported in the table are the percentage of the population and thus not default rates, churn rates, fraud rates, etc. In other words, they nicely add up to 100%. Also observe that the system stability index is defined in a similar way as the information value which is a variable importance metric. A rule of thumb can then be defined as follows:
- SSI < 0.10: no significant shift (green traffic light)
- 0.10 ≤ SSI < 0.25: moderate shift (yellow traffic light)
- SSI ≥ 0.25: significant shift (red traffic light).
To monitor population stability, it is recommended to monitor the system stability index through time as illustrated in this table:
| Score Range |
Expected (training) % |
Observed (actual) % att | Observed (actual) % att + 1 |
| 0-169 | 6% | 7% | 6% |
| 170-179 | 10% | 8% | 7% |
| 180-189 | 9% | 7% | 10% |
| 190-199 | 12% | 9% | 11% |
| 200-209 | 12% | 11% | 10% |
| 210-219 | 8% | 11% | 9% |
| 220-229 | 7% | 10% | 11% |
| 230-239 | 8% | 12% | 11% |
| 240-249 | 12% | 11% | 10% |
| 250+ | 16% | 14% | 15% |
| SSI versus Expected | 0.0605 | 0.494 | |
| SSI versus t – 1 | 0.0260 |
The bottom two rows contain two SSI values. The first one compares the observed or actual population with the expected or training population. The second one then compares the observed or actual population at time t+1 with the population at time t. This allows to see the evolution of the SSI through time and detect when important changes occur. The same traffic light coding can be used as discussed previously.