By: Bart Baesens, Seppe vanden Broucke
This QA first appeared in Data Science Briefings, the DataMiningApps newsletter as a “Free Tweet Consulting Experience” — where we answer a data science or analytics question of 140 characters maximum. Also want to submit your question? Just Tweet us @DataMiningApps. Want to remain anonymous? Then send us a direct message and we’ll keep all your details private. Subscribe now for free if you want to be the first to receive our articles and stay up to data on data science news, or follow us @DataMiningApps.
You asked: How can you do input selection with neural networks?
Our answer:
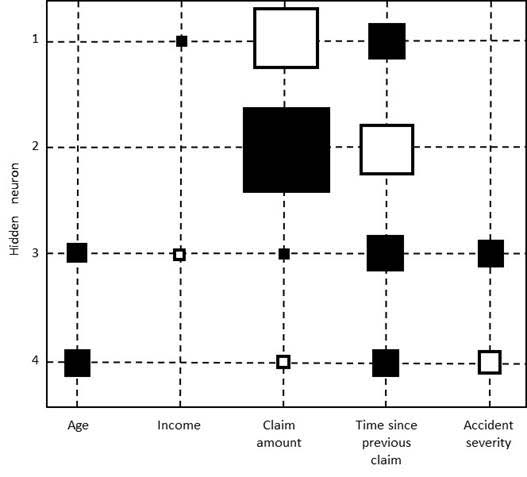
In linear and logistic regression, the variable importance is evaluated by inspecting the p-values. Unfortunately, in neural networks this is not that easy as no p-values are readily available. One easy and attractive way to do it is by visualizing the weights in a Hinton diagram. A Hinton diagram visualizes the weights between the inputs and the hidden neurons as squares, whereby the size of the square is proportional to the size of the weight and the color of the square represents the sign of the weight (e.g. black colors represent a negative weight and white colors a positive weight). Clearly, when all weights connecting a variable to the hidden neurons are close to zero, it does not contribute very actively to the neural network’s computations and one may consider to leave it out. The below figure shows an example of a Hinton diagram for a neural network with 4 hidden neurons and 5 variables. It can be clearly seen that the income variable has a small negative and positive weight when compared to the other variables and can thus be considered for removal from the network. A very straightforward variable selection procedure is:
- Inspect the Hinton diagram and remove the variable whose weights are closest to zero.
- Re-estimate the neural network with the variable removed. To speed up the convergence, it could be beneficial to start from the previous weights.
- Continue with step 1 until a stopping criterion is met. The stopping criterion could be a decrease of predictive performance or a fixed number of steps.
Another way to do variable selection is by using the following backward variable selection procedure:
- Build a neural network with all N variables.
- Remove each variable in turn and re-estimate the network. This will give N networks each having N-1 variables.
- Remove the variable whose absence gives the best performing network (for example, in terms of misclassification error, mean squared error, …).
- Repeat this procedure until the performance decreases significantly.
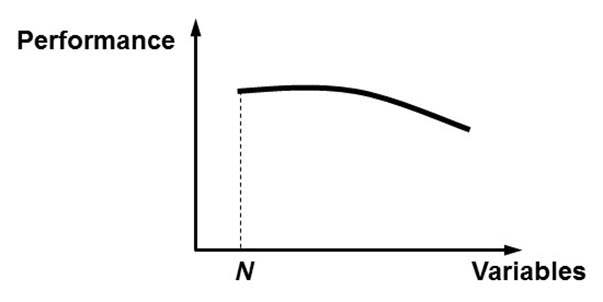
When plotting the performance against the number of variables, a pattern as depicted in the below figure will likely be obtained. Initially, the performance will stagnate, or may even increase somewhat. When important variables are being removed, the performance will start decreasing. The optimal number of variables can then be situated around the elbow region of the plot and can be decided in combination with a business expert. Sampling can be used to make the procedure less resource intensive and more efficient. Note that this performance driven way of variable selection can easily be adopted with other analytical techniques such as linear or logistic regression, Support Vector Machines, etc.


