
Contributed by: Jasmien Lismont
This article first appeared in Data Science Briefings, the DataMiningApps newsletter. Subscribe now for free if you want to be the first to receive our feature articles, or follow us @DataMiningApps. Do you also wish to contribute to Data Science Briefings? Shoot us an e-mail over at briefings@dataminingapps.com and let’s get in touch!
In traditional analytics models, entities are regarded as independent and insights are inferred based on the characteristics of the individual entity only. However, in many settings this is not a realistic picture. A relatively new stream of research on social network analytics aims to tackle this shortcoming. In this blog, we discuss one of our recent projects on social network analytics for accountancy [1].
In reality, we observe considerable variation in taxes being paid [2]. This means that it is worth investigating which characteristics influence these differences in tax planning. In this project, we aim to predict which firms are going to be low-tax firms (compared to their peers). Low-tax companies are those companies which are situated in the lowest quintile of cash effective tax rates adjusted for the industry. On the one hand, this informs management on how they can achieve low tax rates, as this might have an interesting financial impact on the firm and the incentivized managers. On the other hand, these insights inform financial analysts as well as regulatory agencies on which companies are taking on a more risky tax strategy.
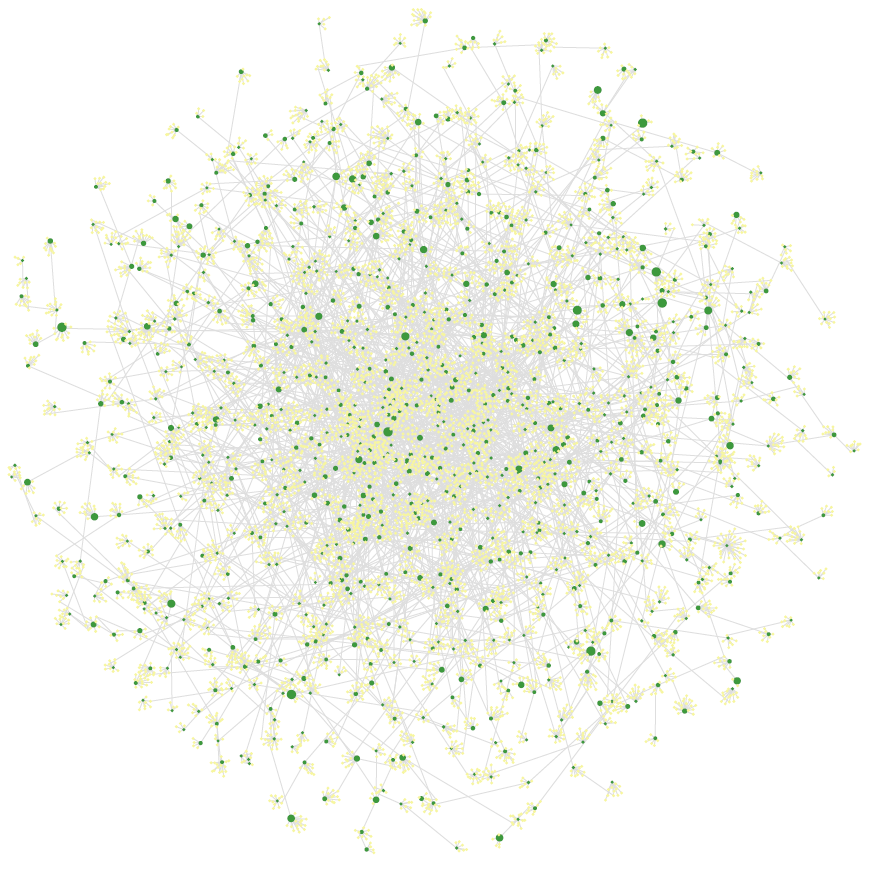
Figure 1: Bipartite network with firms (green) and board members (yellow) which are connected through board membership. The larger the firm, the lower its tax rate. This visualization was created by means of the OpenOrd algorithm [6].
We see that tax planning requires a certain level of expertise and knowledge [3]. It can be assumed that this knowledge can be transferred from one company to another through experienced board members. Therefore, we apply social network analytics techniques in order to capture these effects. As such, we do not regard firms as independent, but also take into account their network. We connect firms by means of shared board members, currently and in the past. This leads to a network (or graph) of firms. In this graph, the entities are called nodes and the links connecting them are called edges. Moreover, edges can receive weights to indicate the strength of the connection. Next, we extract features from this network, also called featurization [4]. Hereby, it plays an important role which network structure we apply. Namely, we work with a unipartite network which contains only firm nodes and for which we weigh the connections with the number of shared board members. Additionally, we construct a bipartite network with two types of nodes (see Figure 1), which contains both the firms and the board members. In the latter, the connections can be unweighted or we can decrease the weight depending on whether the board member is currently holding a position in the firm or has already left the firm [5]. For more information see http://www.dataminingapps.com/dma_research/social-network-analysis/.
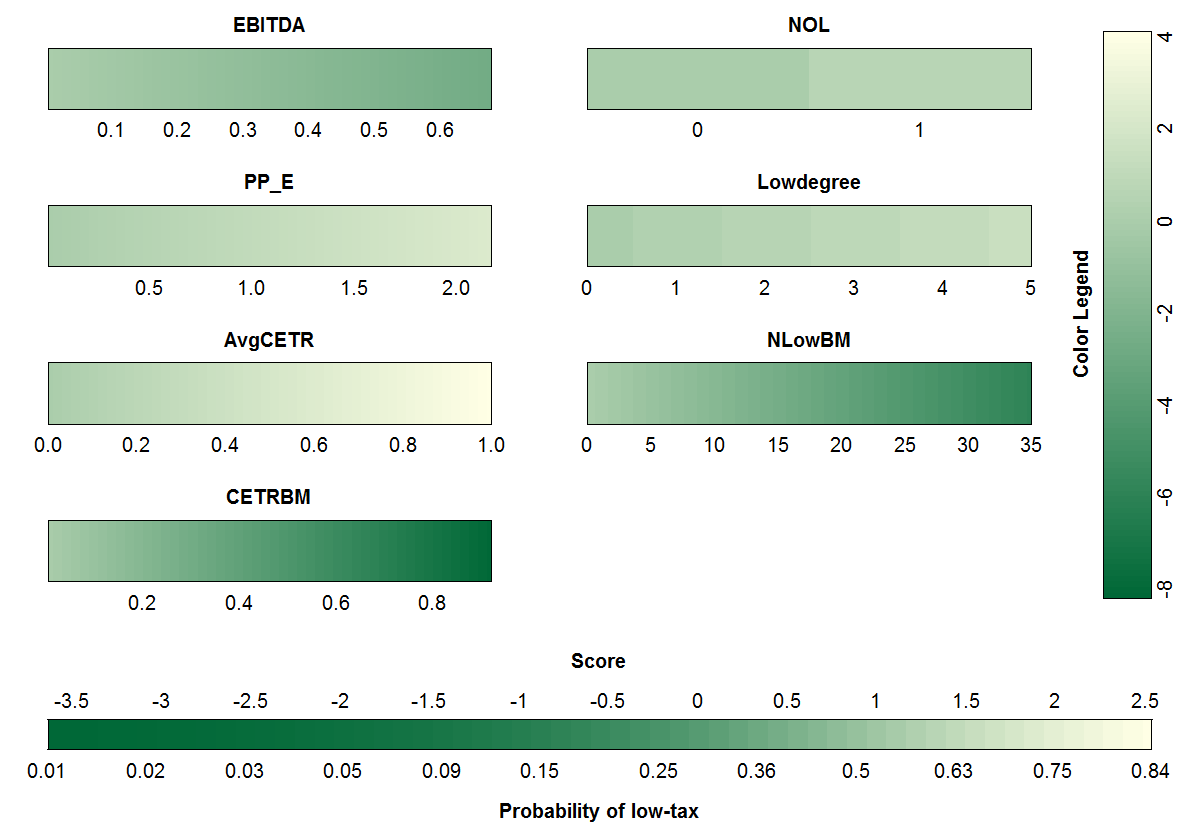
Figure 2: Colored nomogram. The color indicates the extent to which a variable contributes to the probability of being a low-tax firm, and can be converted to points by means of the Color Legend (on the right). To calculate the final probability, all points can be summed and converted by means of the Score bar (at the bottom). This visualization was created based on the work of Van Belle and Van Calster. [7].
Next, we build predictive binary classification models with both firm characteristics and network characteristics. We were able to achieve the best performance by using random forests. Moreover, we were able to increase performance in AUC with more than 7 percentage points by including both types of characteristics instead of using only firm characteristics. Additionally, the bipartite network features play an important role here. Furthermore, this model also significantly increased sensitivity or the ability to identify low-tax firms. Zooming in on the features, we observe that with regards to firm characteristics, a lower EBITDA and higher property, plant and equipment value correlate with a higher low-tax probability. With regards to network characteristics, being connected to many low-tax firms, having less board members with no connections to low-tax firms, having board members with connections to firms with on average a lower cash effective tax rate and having a higher betweenness leads to an increased probability of being low-tax. Here, betweenness represents a centrality measures which tells us how the firm is positioned in the network. A high betweenness means that the firm has a certain ‘broker role’, namely firms can connect to other firms through these ‘broker’ firms. For the logistic regression model, the impact of the features can be visualized by means of a colored nomogram [7], see Figure 2. This graphical representation indicates how each of the features relates to low-tax probability.
We can conclude that:
- Firms do seem to spread knowledge and expertise through their board members;
- We can predictively identify low-tax firms by means of firm characteristics and network characteristics;
- The more detailed bipartite network adds additional predictive power;
- Social network analytics not only contributes to predictive performance but also helps to better explain reality.
References
- Lismont, J., Cardinaels, E., Bruynseels, L., De Groote, S., Baesens, B., Lemahieu, W. and Vanthienen, J. Predicting tax avoidance by means of social network analytics. Decision Support Systems, 2018. Doi: 10.1016/j.dss.2018.02.001.
- Christensen, D. M., Dhaliwal, D. S., Boivie, S., and Graffin, S. D. Top management conservatism and corporate risk strategies: Evidence from managers’ personal political orientation and corporate tax avoidance. Strategic Management Journal, 36(12): 1918–1938, 2015.
- Gallemore, J., and Labro, E. The importance of the internal information environment for tax avoidance. Journal of Accounting and Economics, 60(1): 149–167,2015.
- Kramer, S., Lavrač, N., and Flach, P. (2001). Propositionalization approaches to relational datamining. In S. Džeroski, & N. Lavrač (Eds.), Relational Data Mining (pp. 262–291).
- Van Vlasselaer, V., Eliassi-Rad, T., Akoglu, L., Snoeck, M., and Baesens, B. (2017). GOTCHA! Network-based fraud detection for social security fraud. Management Science, 63, 3090–3110.
- Martin, S., Brown, W. M., Klavans, R., and Boyack, K. W. OpenOrd: An open-source toolbox for large graph layout. In Visualization and Data Analysis 2011, San Fransisco Airport, CA, USA, January 24-25, 2011, SPIE Proceedings, page 786806, 2011.
- Van Belle, V., and Van Calster, B. (2015). Visualizing risk prediction models. PLoS ONE, 10, e0132614.