
Contributed by: Jasmien Lismont
This article first appeared in Data Science Briefings, the DataMiningApps newsletter. Subscribe now for free if you want to be the first to receive our feature articles, or follow us @DataMiningApps. Do you also wish to contribute to Data Science Briefings? Shoot us an e-mail over at briefings@dataminingapps.com and let’s get in touch!
Traditionally, customers are regarded as independently acting when we build our marketing, churn prediction or sales forecasting models. However, this does not represent reality. In retail, certain customers show similar behaviour. Imagine, for example, two students during their exams. One might recommend the other an energy drink which s/he liked. As such, individual purchase behaviour can be affected by social or peer influence. On the other hand, both friends might buy this energy drink because they are very alike and both have an exam tomorrow. This relates to the concept of homophily, which assumes that more similar people are more likely to form a connection [2]. Moreover, correlations in product adoption are often due to similarity and not social interactions [3]. This observation can be used to our advantage when we are building descriptive or predictive analytics models in retail.
There are several ways in which we can integrate network effects. Because similarity proved to be more important than social interaction, we do not focus on actual social networks of customers, but rather on “pseudo-social” networks [4] in which customers are connected who do not know each other in reality. In retail, these pseudo-social graphs can be divided into two types: co-purchase networks and customer-product graphs. The former builds a network of products which are purchased at the same time by the same customer. E.g. all products in one virtual shopping cart of the online retailer Amazon. Customer-product graphs, on the other hand, link customers and the products they have bought during a certain time period. Thus, these graphs do not require that the products are purchased at the same time. Depending on your application and setting, you might prefer one network over the other. E.g., when an online retailer tries to recommend products which are frequently sold together, co-purchase graphs are more interesting. When we try to capture customer preferences, customer-product graphs are more applicable [5] since they do not have a time restriction.
We applied customer-product graphs [1] on purchase data of an offline European low-cost retailer active in food and non-food. A small example is shown in Figure 1. We connect customers and the products they have bought in the same store. Our main goal is to predict which products are going to significantly decline in sales. This is particularly useful for marketing experts, but can also be used in supply chain and logistics, store layout planning, and even strategic decision making. For this purpose, we apply a process called featurization, which means that we extract variables from our customer-product graph. We can either extract the features directly from this graph, or we can first transform this graph to a unipartite graph consisting only out of products. Finally, we end up with a set of product characteristics and a set of network characteristics, which can be used to leverage the customer preferences of the network.
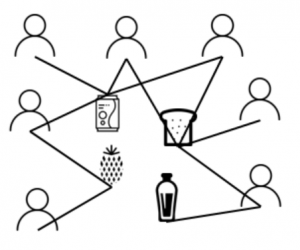
Figure 1: Small example of a customer-product graph
Our best performing model is a random forest model which uses both product and network variables. This model is specifically better in identifying those products which are going to decline in sales, compared to a model containing only product characteristics. We can take a closer look at the variables which proved to be important. Then, we observe that pricing details (e.g. promotions) and how customers paid for their products have a big influence. This last characteristic might actually be capturing other characteristics, such as the type of shopping basket, age, etc. With regards to the network, we see that the neighbouring products are valuable. As such, if a product is connected to products which significantly declined in sales, the product itself is also more likely to lose sales. Additionally, the number of complements and substitutes and their behaviour will also impact the product of interest. Moreover, taking into account the recency, frequency and monetary (RFM) value of specific customer-product connections adds predictive performance. Finally, a personalized PageRank score and the local clustering coefficient proved to be important.
We can conclude that we can use aggregated customer preferences in offline retail by means of customer-product graphs. Purchasing behaviour of particular products can, to a certain extent, be inferred from its links to other products. Not only can network analytics improve the predictive abilities of analytics models, it also captures reality better.
Key takeaways:
- We can leverage customer and product similarity in retail by means of two types of networks: co-purchase graphs and customer-product graphs.
- Customer-product graphs are better able to capture customer preferences.
- Bipartite measures, such as the RFM scores of edges in the customer-product graph, add predictive power.
- The behavior of the close neighborhood of products helps in predicting its sales.
- Personalized PageRank and the local clustering coefficient are interesting network measures for capturing customer preferences.
References
- [1] Lismont, J., Ram, S., Vanthienen, J., Lemahieu, W., Baesens, B. Predicting interpurchase time increase for retail products using customer-product networks. Work in process.
- [2] McPherson, M., Smith-Lovin, L., & Cook, J. M. (2001). Birds of a feather: Homophily in social networks. Annual Review of Sociology, 27, 415–444.
- [3] Aral, S., Muchnik, L., & Sundararajan, A. (2009). Distinguishing influence-based contagion from homophily-driven diffusion in dynamic networks. Proceedings of the National Academy of Sciences, 106, 21544–21549.
- [4] Martens, D., Provost, F. J., Clark, J., & de Fortuny, E. J. (2016). Mining massive fine-grained behavior data to improve predictive analytics. MIS Quarterly, 40, 869–888.
- [5] Kim, H. K., Kim, J. K., & Chen, Q. Y. (2012). A product network analysis for extending the market basket analysis. Expert Systems with Applications, 39, 7403–7410.