
This article first appeared in Data Science Briefings, the DataMiningApps newsletter. Subscribe now for free if you want to be the first to receive our feature articles, or follow us @DataMiningApps. Do you also wish to contribute to Data Science Briefings? Shoot us an e-mail over at briefings@dataminingapps.com and let’s get in touch!
Contributed by: Bart Baesens
Machine Learning is all around in the news these days. McDonald’s buys into machine learning to help serve up data driven meal choices. Machine learning is also used in agriculture where scientists are teaching computers to diagnose soybean stress. It is currently also being used in the fight against COVID 19 with the first Kaggle competitions already started. One of the reasons why Leicester won the premiership title in 2015-2016 was thanks to machine learning. Obviously, machine learning is also extensively used in finance.
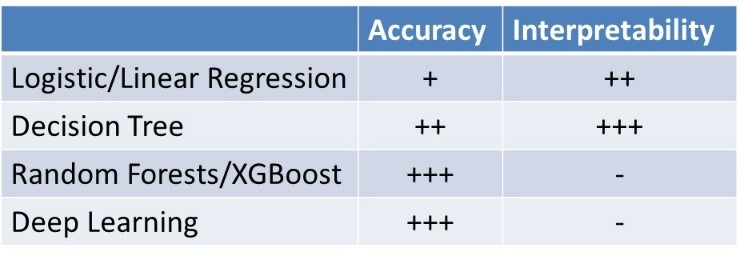
Depending upon the context (e.g., credit scoring, churn prediction, fraud detection, medical diagnosis, etc.), machine learning models are evaluated in terms of their statistical accuracy, interpretability, profit and/or regulatory compliance. Below you can see some commonly used machine learning techniques contrasted in terms of each of these criteria.
A first secret in boosting the performance of your machine learning model is feature engineering. We already discussed this in a previous DataMiningApps newsletter but let’s briefly refresh. The aim of feature engineering is to transform data set variables into features so as to help the analytical models achieve better performance in terms of either predictive performance, interpretability or both. Hence, when doing feature engineering it is important to take the bias of your analytical technique into account. As an example, a logistic regression assumes a linear decision boundary to separate both classes. Hence, when defining smart features for logistic regression, your aim is to make sure that these new features make the data linearly separable. That will allow the logistic regression to come up with the best model possible. A very simple of feature engineering is deriving the age from the date of birth variable. Feature engineering can be done manually, by the data scientist typically in collaboration with the business user, or fully automated using sophisticated techniques such as deep learning. The importance of feature engineering cannot be underestimated. It is our firm conviction that the best way to improve the performance of an analytical model is by designing smart features, rather than focusing too much on the choice of the analytical technique. Commonly used feature engineering techniques are the following:
- Trend features
- Logarithmic transformation/Power transformation
- Box-Cox transformation
- Yeo-Johnson transformation
- Principal Component Analysis
- Percentile coding
- Weights of Evidence (WOE) coding
- Thermometer coding
The Yeo Johnson transformation is one of our favorite transformations and you can see it defined here.
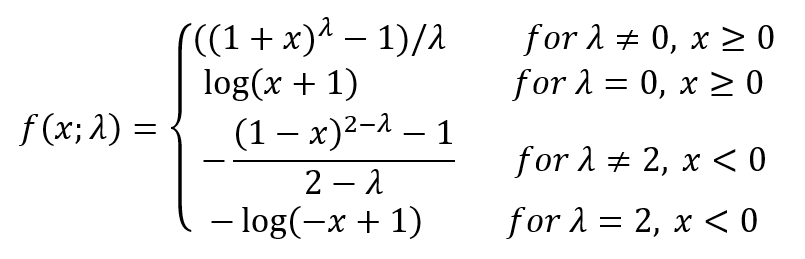
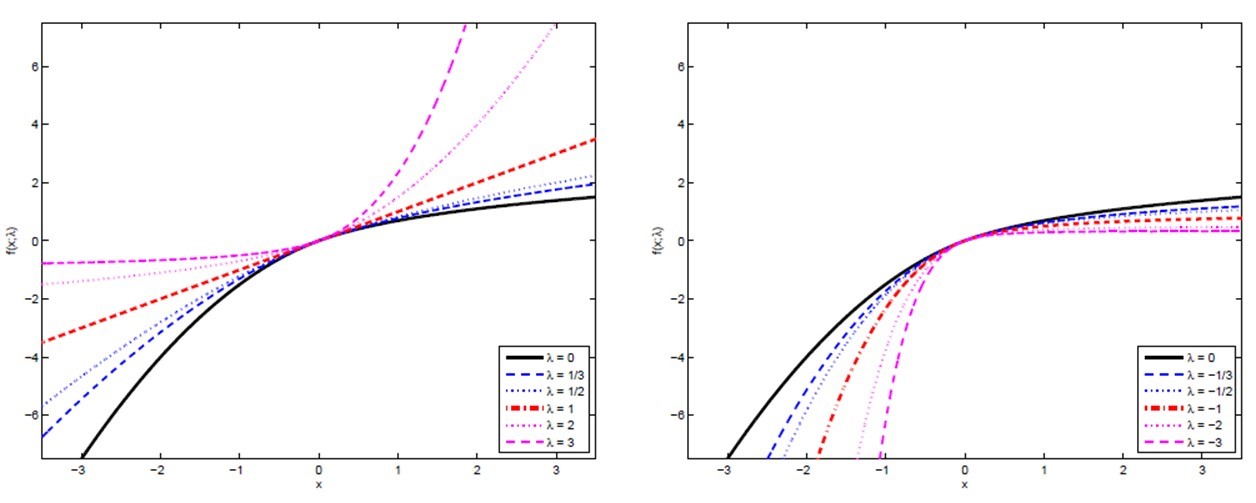
It has 1 parameter lambda. It can be easily verified that for λ = 1 the identity transformation is obtained. If λ = 0, the logarithmic transformation is applied to the positive values, whereas negative values are transformed accordingly via a smooth transition between positive and negative values. If λ = 2, the logarithmic transformation is applied to the negative values, whereas positive values are transformed accordingly via a smooth transition between positive and negative values. The lambda parameter can be set by through experimentation, by visually inspecting the distribution of the transformed variable, or by optimizing a performance measure on a validation set such as the AUC or maximum profit. Below you can see the Yeo-Johnson transformation illustrated. To the left you can see it for positive values of lambda, whereas to the right you can see it for negative values of lambda.
Here you can see an example of applying the Yeo Johnson transformation for the variable total Capital ratio used to assign bank ratings.
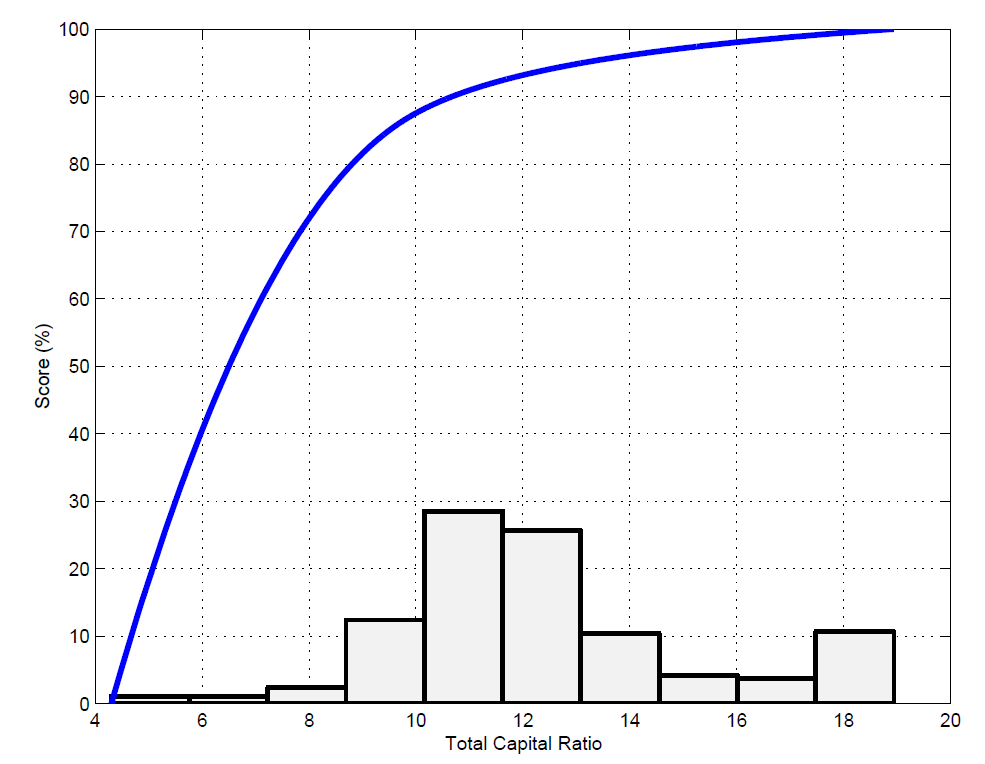
The figure illustrates the original histogram and the transformation itself. It can be seen that the transformation identifies a soft cut-off at ±8%, below which a bank is penalized in its rating and above 8-10% where a saturation effect occurs. Hence, these transformation can really identify interesting novel business insights which help to contribute in understanding the dynamics of credit risk. For more information, I refer to the citation below.
A second secret to boost to performance of your machine learning models is to leverage innovative sources of data. Some examples are:
- Call Detail Record (CDR) Data
- Social Media Data
- Google Street View
- Google Trends
- API/Web Scraping
- Open data
So let’s discuss call detail record data based on a recent paper of us. The idea is to use call detail record or CDR data for credit scoring. It is of key importance to properly respect privacy and ethics regulation and always inform customers about how their data is being used when doing this. Previous research indicated that people tend to call those in their economic circle. Hence, this could be interesting to inspect default influence for credit scoring. A key challenge here is to appropriately featurize call detail records or CDR data so as to obtain good predictive power for credit risk modeling. This links back to my earlier point on feature engineering. The engineered features can then be combined with other data, such as socio-demographic characteristics, to develop high performing scorecards.
In our research, we found that combining CDR data with traditional data for credit risk modeling significantly increases the AUC performance. We also studied the impact on profitability and found that the best model was built with only calling behavior features. Hence, calling behavior features are predictive both in terms of statistical and economic performance. Our results may also have a financial inclusion impact that affect borrowers in developed and developing countries in different ways. In the former case, people who are joining the financial market for the first time, such as young people and immigrants, face troubles when applying for loans because they do not have a credit history. Instead, they need to spend time and effort to build their credit history before financial institutions can assess whether they are creditworthy. In developing countries where historical financial data is often nonexistent, the impact is even greater. In contrast to the lack of banking history, the high(er) availability of call data in these countries provides an alternative for credit scoring, hereby facilitating credit access and financial inclusion to a wider segment of the population. According to our results, features extracted from these untraditional data sources are good predictors of credit behavior. The results of our study are furthermore affected by privacy regulations because the implementation of some of the models depends on different parties sharing the data. Since there are no worldwide applicable standards for data-sharing of that kind, we strongly urge and advise to check local privacy regulations and ethical guidelines and make sure these are always properly adhered to and respected. For more information about this research, we are happy to refer to our paper cited once more below.
Secret 3 relates to profit driven machine learning. A well-known question in machine learning is: which model is the best? Winning machine learning models are often selected based on accuracy related performance measures such as area under the ROC curve, top-decile lift, classification accuracy etc. Maximization of profit is typically not taken into account and often times the same costs for false negatives and false positives are assumed. One of the ideas we have been working recently is to create a performance metric that takes profit into account. A next step is then to incorporate this profit measure directly into the construction of the classifier.
In 2013, together with my colleagues Thomas Verbraken and Wouter Verbeke, we developed the expected maximum profit measure for customer churn (EMPC). You can see its definition here.
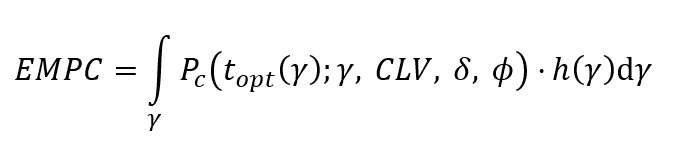
Note that it measures profit in Euro per customer. For the background of this definition, we refer to our original paper. Note that we also extended this definition to the application field of credit scoring. Our EMPC measure can now be used in various ways. First of all, it can be used to select the most profitable machine learning model in the evaluation step. However, this implies that profit is not directly integrated into the model construction itself, which would a lot cooler! Hence, in follow-up research, we built logistic regression and tree classifiers that directly incorporate the EMPC in the construction of the machine learning model. This led to the development of ProfLogit and ProfTree. Both make use of a genetic/evolutionary algorithm to determine the model parameters. You can see the references to both papers at the bottom.
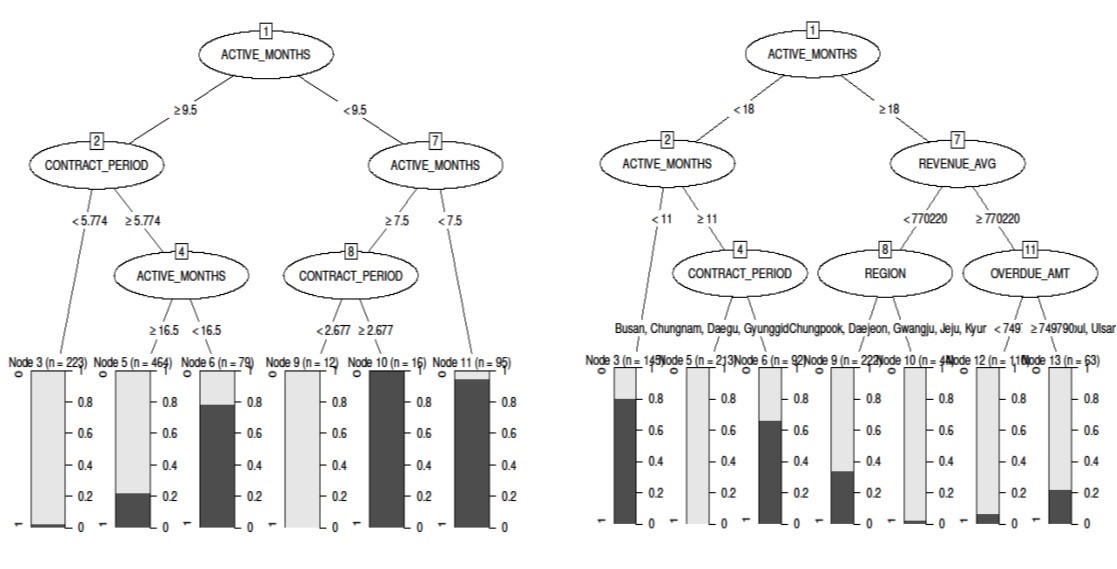
Below you can see a classical decision tree, illustrated to the left, contrasted with a ProfTree, illustrated to the right. Note the differences in splits. Also note the difference in EMPC value. The ProfTree yields an extra profit of 1.19 Euro per customer which can get quite substantial for large customer portfolios.
To summarize, in this article, we discussed 3 techniques to boost the performance of your machine learning models: feature engineering, leveraging innovative sources of data and profit driven machine learning.