
By: Klaas Nelissen, Monique Snoeck, Seppe vanden Broucke, Bart Baesens
This article first appeared in Data Science Briefings, the DataMiningApps newsletter. Subscribe now for free if you want to be the first to receive our feature articles, or follow us @DataMiningApps. Do you also wish to contribute to Data Science Briefings? Shoot us an e-mail over at briefings@dataminingapps.com and let’s get in touch!
Are your users or customers engaged with the product or service you are delivering to them? Every time a user interacts with your business, you’re delivering a certain user experience a user will be engaged with to a certain extent.
But what is user engagement? Well, it’s different for every application. For Facebook, engaged users probably like and comment more than others. On Amazon, there is no liking and commenting, but a user can demonstrate higher engagement by putting a certain item on a wish list, or reviewing a purchased item. For Spotify, users can be considered more engaged if they perform more searches for just-released songs.
In these three examples, a much better measure of user engagement could be achieved if what the user was feeling and thinking is also taken into account. However, the state of the art in the industry for measuring user engagement only considers behavioral metrics. Behavioral metrics are those metrics that are based on only the physical interactions a user can have with the service or product. By physical interactions, we mean the clicks, scrolls, swipes, taps, and all other actions a user can do on the device. So these behavioral metrics don’t get more sophisticated than a combination of Time On Page, Page Views per Session, Clicks per Session, Session Duration and so on.
We’ve seen many companies focusing only on behavioral metrics and sliding away into the black hole of clickbaiting. For content businesses, who maximize revenues primarily coming from the amount of advertisements they can show users, this is understandable. Unfortunately, engagement is only optimized on the short term by creating headlines that provoke a huge curiosity gap with readers (to give an example: ‘X happened. You’ll never guess what happened next.’ Or: ‘Y said this. This is what Z said in response.’), deconstructing one post in 4 different pages (each page with their own ads, of course), or putting otherwise normal content in listicles (‘Top 7 reasons that …’, ‘The craziest 11 X of Y’). (Take a look at this headline generator which parodies the concept.)
When measuring user engagement, we should focus on measuring it comprehensively, taking into account not only the ‘clicks’, but also how the user feels (affection) and what she thinks (cognition) during the experience. The affective dimension focuses on the emotions people feel during the user experience. Emotions are important to bring into the calculation of user engagement because a user won’t be very happy with an experience where she gets frustrated with herself because she fell for the clickbait – again. Each user also brings her own cognitive state to an experience, meaning that every user has her own interests, motivations, expectations and context that influence a user’s experience and the corresponding level of engagement. Due to each user’s unique profile, a reading session of five minutes on a particular website might satisfy a daily active user, but is probably disappointing for a weekly active user. A user’s context thus greatly influences her optimal level of engagement, but in general are deviations from average behavior an indication of changes in engagement levels.
At our KU Leuven LIRIS research group, we’re currently part of an ongoing research project that tries to measure user engagement comprehensively with people who read their newspaper on tablets. The project is a multidisciplinary effort between several Belgian partners: two research groups of the KU Leuven, iMinds, and the companies Twipe and Mediahuis. Mediahuis is one of the biggest newspaper publishers in Belgium, Twipe is a software company that allows traditional content creators to publish their content to tablets, and iMinds is a governmental organization orchestrating knowledge transfer from academia to industry.
To capture the affective and cognitive dimensions of user engagement, we set up qualitative experiments. 58 news readers of the second most-read Flemish newspaper were invited for an interview with a market research expert. Next to the interview, participants also read the newspaper like they normally would at home. During this reading session, several sensors were attached to the participants to capture physiological signals, and all possible interactions a user had with the tablet were collected. If different newspaper articles have significantly different physiological responses, we will be able to discern between more and less ‘arousing’ articles.
We used the Pupil Pro eye-tracker, an ECG sensor, the Empatica wristband to measure skin conductance and temperature and a Kinect to collect body posture data. For each user, we have a lot of physiological data while she was reading the newspaper.
However, reading a newspaper is an everyday experience. We don’t expect to see much variation in emotions the participants experienced while reading the newspaper. Compare this to a gaming experience, where emotions (and thus the physiological feedback) might be stronger, for example when successfully progressing in a game or losing over and over and getting frustrated.
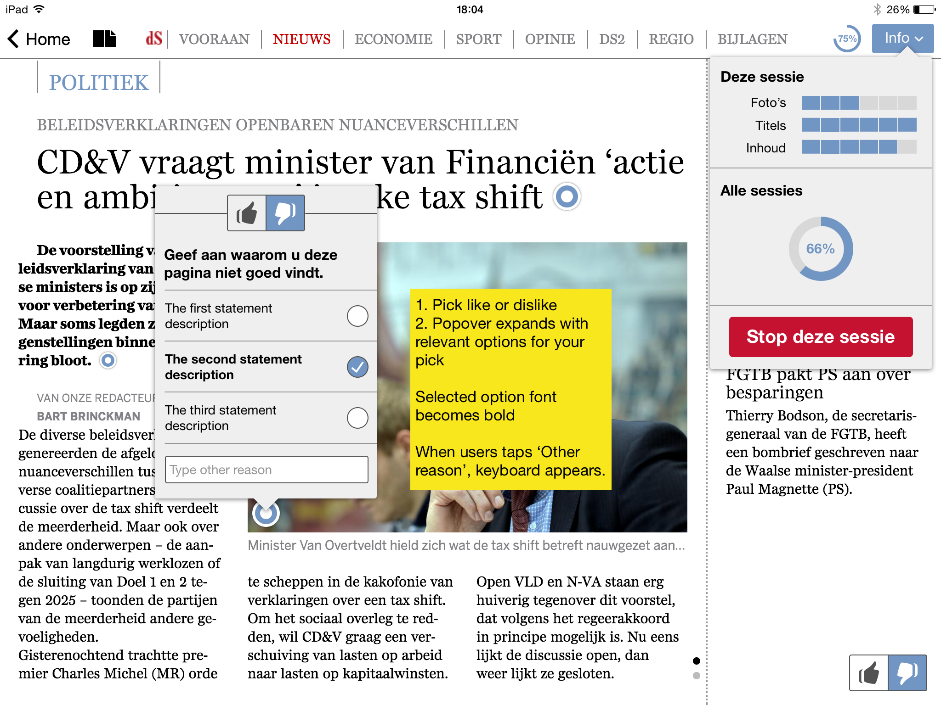
In June 2015, we conducted our first quantitative experiments. More than 220 people used a modified tablet app of the newspaper during a month. The tablet app was modified again so every interaction was trackable: every swipe, every tap, every movement of the tablet got captured. Another modification was that the user had the opportunity to provide in-app feedback. The figure hereunder gives an overview of how the process of giving in-app feedback worked.
This project also helps newspaper publishers to become more data-driven. From a data-driven point of view of the newspaper creation process, the daily decisions about which articles should be in the newspaper of tomorrow should not only be based on the (very good) gut-feeling, intuition and anecdotical impressions of the editorial board. These decisions should also be based on how well an article will resonate with the target audience. We simplify this to how well similar articles resonated with the target audience in the past and then predicting new article performance. This project enables better decision-making based on historical article performance in terms of engaged users.
To give a final real-life example, in a certain publication an article on page 7 about how people could save a significant amount of money by using less water resonated disproportionately much with newsreaders. This was counter-intuitive for the deputy editor in chief, who thought this article to be a normal, unspecial article that belonged on page 7. Due to this insight, the deputy editor in chief now knows that future articles on personal finance do (under certain constraints) resonate well with their audience, and might consider putting those articles on an earlier page of the newspaper.
Eventually, the goal of this project is to build a brand-agnostic engagement model for the newspaper industry. To be able to achieve that, both the qualitative and quantitative experiments will be repeated for a different newspaper from the same media company, Mediahuis.
To summarize, the key takeaways of this article are:
- There is no silver bullet for measuring user engagement, it is different for different applications;
- If you try to measure user engagement, don’t forget to try and model the user’s emotions and baseline behavioral profile;
- The insights following from measuring user engagement allow better decision-making because business processes can be made more data-driven.