
By: Bart Baesens, Seppe vanden Broucke
This QA first appeared in Data Science Briefings, the DataMiningApps newsletter as a “Free Tweet Consulting Experience” — where we answer a data science or analytics question of 140 characters maximum. Also want to submit your question? Just Tweet us @DataMiningApps. Want to remain anonymous? Then send us a direct message and we’ll keep all your details private. Subscribe now for free if you want to be the first to receive our articles and stay up to data on data science news, or follow us @DataMiningApps.
You asked: What is a REC curve in a regression context?
Our answer:
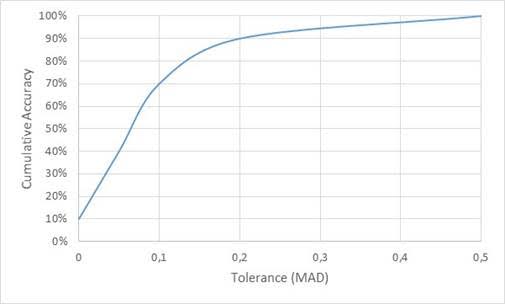
A regression error characteristic or REC curve is a regression variant of the ROC curve in classification and plots the error tolerance on the X-axis versus the percentage of points predicted within the tolerance on the Y-axis. The resulting curve estimates the cumulative distribution function of the error. The error on the X-axis can be defined as the squared error or the absolute deviation . Just as with the ROC curve, the perfect model is situated in the upper left corner. Hence, the quicker the curve approaches this point, the better the model. The area above the curve then represents an overall error measure which should preferably be as small as possible. As an example, consider the data represented below.
| Tolerance (X) | Correct predictions (cumulative) |
Cumulative Accuracy (Y) |
| 0 | 1 | 10% |
| 0,05 | 4 | 40% |
| 0,1 | 7 | 70% |
| 0,2 | 9 | 90% |
| 0,5 | 10 | 100% |
The corresponding REC curve is depicted in the following figure.
 |