
Contributed by: María Óskarsdóttir, Bart Baesens, Seppe vanden Broucke
This article first appeared in Data Science Briefings, the DataMiningApps newsletter. Subscribe now for free if you want to be the first to receive our feature articles, or follow us @DataMiningApps. Do you also wish to contribute to Data Science Briefings? Shoot us an e-mail over at briefings@dataminingapps.com and let’s get in touch!
Evaluating the performance of predictive models is an important step in any data driven application. In business scenarios, when such models are used to make decisions based on the data, taking into account the expected profits resulting from their deployment has obvious benefits because it facilitates putting an actual value on the model itself. Thus, the business reality becomes a part of the evaluation. The profit centric Expected Maximum Profit measure (EMP) was developed with this objective as it considers the business reality of binary classification problems when evaluating model performance [1]. It has been formulated for two scenarios by taking into account the specific requirements of each one: churn prediction and credit scoring. In the case of churn prediction, where the goal is to identify the customers that are most likely to leave the company, the measure maximizes the expected profit accompanied by a retention campaign, when taking into account the losses and gains of misclassifying customers, the cost of the campaign and the retention offer [1]. Here, we focus on the second scenario for the Expected Maximum Profit measure: credit scoring.
Credit scoring has a long history in predictive modelling and it is important e.g. in financial institutions because it concerns distinguishing defaulters from non-defaulters when it comes to granting loans. By building predictive models using historical data, a probability score is assigned to each customer, with a higher score meaning that the customer is more likely to default on the loan. By deciding a threshold or a cut-off value on the scores, the financial institution subsequently grants a loan to everyone who has a score that is lower than the cut-off but rejects the application if the score is higher. The Expected Maximum Profit measure takes into account the profits received by the non-defaulters and the losses caused by the defaulters and computes an EMP value that is expressed as a percentage of the total loan amount and measures the incremental profit relative to not building a credit scoring model [2].
In addition to returning a value for the Expected Maximum Profit, the measure also provides a profit maximizing fraction, which indicates the proportion of customers who should be rejected a loan, in order to achieve the maximum profit. This fraction is a unique property of the measure and allows the modeller to compute the profit of the model. Before computing the model profit, some information is needed. First, the benefit of correctly identifying a defaulter needs to be estimated. In the EMP it is typically defined as
λ := (LGD·EAD) / A
where LGD is the loss given default, EAD the exposure at default and A is the principal of the loan. Furthermore, ROI, the return on investment of the loan, is assumed to equal the cost of incorrectly classifying a good applicant as a defaulter.
We will now demonstrate how to compute the model profit using the example dataset in table 1 below:
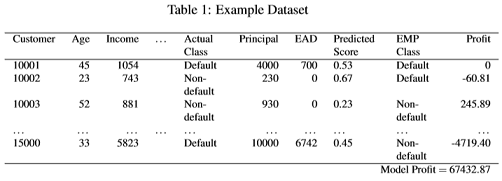
We assume that a credit scoring model has already been built using a training set and that the data in table 1 is the corresponding test set that contains 5000 observations to evaluate the model. The first step is to apply the model to the test set to produce the predicted scores in column ‘Predicted Score’. Next, the Expected Maximum Profit measure is computed using the columns ‘ActualClass’ and ‘Predicted Score’ which, in this case, gives the result
EMP = 1.65%, EMP fraction = 0.0544.
The second value indicates that 5.44% of the loan applications should be rejected in order to achieve the EMP of 1.65%. This means that in the testset, 0.0544·5000=272 loans should be rejected. We label the customers accordingly by assigning the label ‘Default’ to the 272 customers with the highest scores and ‘Non-default’ to the rest.
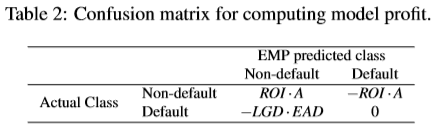
This is indicated by the column ‘EMPClass’ in table 1. The next step is to compute the profit (or loss) generated by each customer. We use the confusion matrix in table 2 that shows how much profit is achieved when non-defaulters and defaulters are classified correctly and incorrectly. Note that in this case LGD = 0.7 and ROI = 0.2644. The profit of each customer can be seen in the column ‘Profit’. Finally, by adding together all the values in column ’Profit’ the model profit is achieved.
Above we have shown that the Expected Maximum Profit measure can easily be applied to compute the profit of credit scoring models. As a result, the modeller obtains a measure of performance that is not only highly relevant for the business user but also easy to comprehend.
References
- [1] Verbraken,T., Verbeke,W., & Baesens,B. (2013). A novel profit maximizing metric for measuring classification performance of customer churn prediction models. IEEE transactions on knowledge and data engineering, 25(5), 961-973.
- [2] Verbraken, T., Bravo, C., Weber, R., & Baesens, B. (2014). Development and application of consumer credit scoring models using profit-based classification measures. European Journal of Operational Research, 238(2), 505-513.